
| Channel | Publish Date | Thumbnail & View Count | Actions |
|---|---|---|---|
 Mike Davis Mike Davis | 2016-04-12 15:02:58 | 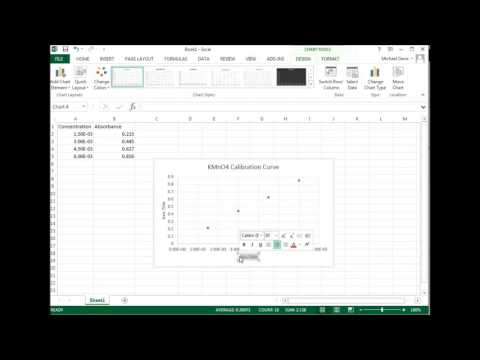 398,548 Views |
This video shows how you can use Excel to make a simple calibration curve. This was done for a Beer’s Law plot with Absorbance vs. Concentration. We determine the formula for the best fit curve, and then use the absorbance of our unknown and get a concentration.
Please take the opportunity to connect and share this video with your friends and family if you find it useful.


