| Channel | Publish Date | Thumbnail & View Count | Actions |
|---|---|---|---|
 The Excel Challenge The Excel Challenge | 2017-04-27 05:44:20 |  3,330,246 Views |
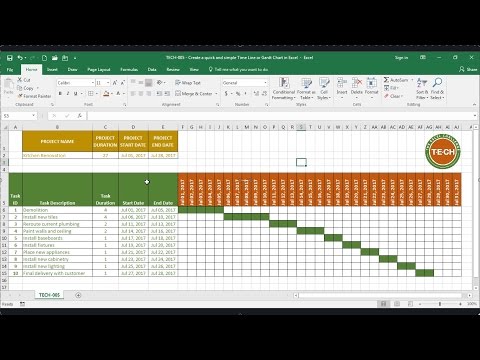
Learn how to create a quick and simple Time Line (Gantt Chart) in Excel.
In this video you will use the MIN formula, the MAX formula, the IF formula, the AND formula, as well as ‘Greater Than’ and ‘Less Than’ conditions to create the Time Line (Gantt Chart) in your spreadsheet. You will also use Conditional Formatting to enhance the looks of your Time Line.
I hope this tool is something you can use in your daily routine so you get more with less effort.
If you have a challenge with Excel that you need help with, whether it is at work, at home, or at school, please write it in the comments below. I try to resolve common Excel challenges from our viewers and subscribers.
Thank you for watching.
Check out some of our previous videos in the links below:
* TECH-004 – Calculate total days between dates in Excel
https://www.youtube.com/watch?v=5q_hBywbKys
* TECH-003 – Display images in comments
https://www.youtube.com/watch?v=nVdNMXp-bSU
* TECH-002 – Find intersecting values in a table in Excel
https://www.youtube.com/watch?v=UfvhhbMBDO8
Please take the opportunity to connect and share this video with your friends and family if you find it useful.


