
| Channel | Publish Date | Thumbnail & View Count | Actions |
|---|---|---|---|
 Piggy Bank Accountant Piggy Bank Accountant | 2023-03-18 14:15:28 | 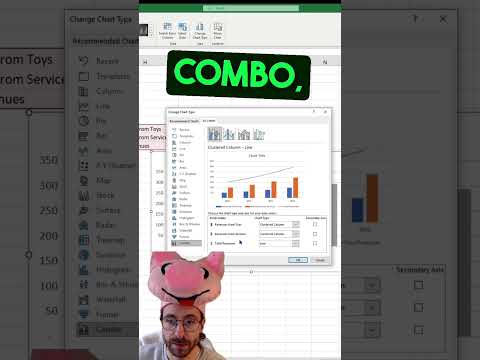 3,695 Views |
In this video, I’m going to teach you how to use Excel charts to create clean visual storytelling. By mastering the secondary axis, you’ll be able to create charts that are easy to read and conveys your message clearly.
If you’re looking to improve your Excel skills, this video is for you! By the end of this lesson, you’ll be able to create charts that are perfect for telling your story in a clean and visual way. So don’t miss it!
Please take the opportunity to connect and share this video with your friends and family if you find it useful.


