| Channel | Publish Date | Thumbnail & View Count | Actions |
|---|---|---|---|
 Someka Someka | 2018-05-03 09:19:20 |  24,459 Views |
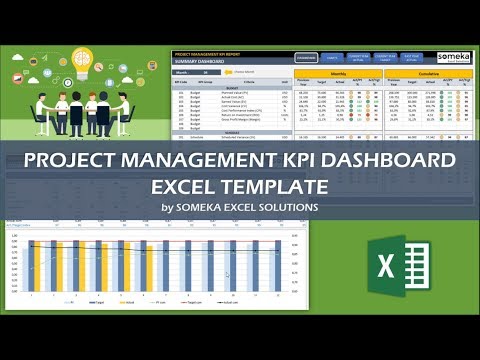
This Project Management KPI Dashboard incorporates 15 KPIs for Project Management key metrics such as CPI and SV and provides comparisons, trend charts under 3 main category:
BUDGET
(Planned Value (PV), Actual Cost (AC), Earned Value (EV), Cost Variance (CV), Cost Performance Index (CPI), Return on Investment (ROI), Gross Profit Margin)
SCHEDULE
Scheduled Variance (SV), Schedule Performance Index (SPI), Planned Vs Actual Work Hours)
EFFECTIVENESS
(Resource Utilization, Overdue Tasks / Crossed Deadlines, Missed Milestones Ratio, Percentage Of Tasks Completed, Tasks % Completed On Time)
————————————————————————————————————-
Project Management KPI Dashboard Template Features Summary:
# Monthly and Aggregate Breakdowns
# Assessment of Prior Year and Target Values
# Dashboard synopsis with interactive charts
# A simple design which is easy to use for presentations
# Precise instructions (on-sheet)
# Compatibility with Excel 2007 (and later)
# Fully functioning with Window and Mac
# No set-up required.
# Pre-designed Project Tracker in Excel
# No Excel VBA macros
DOWNLOAD: https://www.someka.net/excel-template/project-management-kpi-dashboard/
————————————————————————————————————-
Keep Up With Us:
Someka ► https://www.someka.net
Facebook ► https://www.facebook.com/SomekaNet/
Twitter ► https://twitter.com/SomekaNet
Linkedin ► https://www.linkedin.com/company/someka-excel-solutions
Youtube ► https://www.youtube.com/channel/UCo1-3D6LQb7C75yihFsBfWg?sub_confirmation=1
#projectmanagement #exceldashboard #kpi
Please take the opportunity to connect and share this video with your friends and family if you find it useful.


