
| Channel | Publish Date | Thumbnail & View Count | Actions |
|---|---|---|---|
 Rabi Gurung Rabi Gurung | 2024-12-07 13:01:14 | 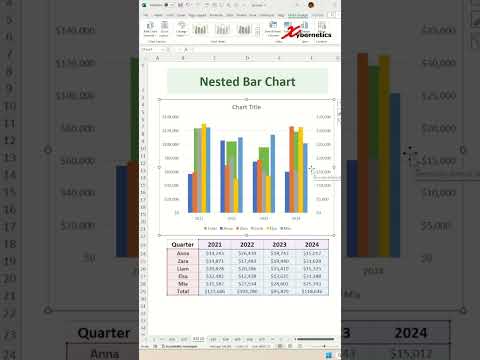 1,271 Views |
Discover how to create nested bar chart in Excel.
Insert Clustered Bar Chart
1) Ctrl+A
2) Alt+F1
3) Resize and reposition
Switch Axis
1) Chart Design ~ Switch Row/Column
Share Secondary Axis
1) Change Chart Type
2) Combo
3) All charts need to be /”Clustered Column/”.
4) Check on /”Secondary Axis/” all series.
Except /”Total/”.
5) Ok
6) Right-click on /”Secondary Axis/” ~ Format Axis…
7) Axis Option
8) Maximum = 120000 (or same as /”Primary Axis/”)
9) Enter
10) Delete /”Secondary Axis/”
Total Bar Chart
1) Right-click /”Total/” bar chart
2) Series Option
3) Gap Width = 30%
4) Fill and Line
5) Fill = Light green
No borders
6) Chart Elements ~ Data Labels
#excel #tips #shorts #fyp
Please take the opportunity to connect and share this video with your friends and family if you find it useful.


