
| Channel | Publish Date | Thumbnail & View Count | Actions |
|---|---|---|---|
 | Publish Date not found | 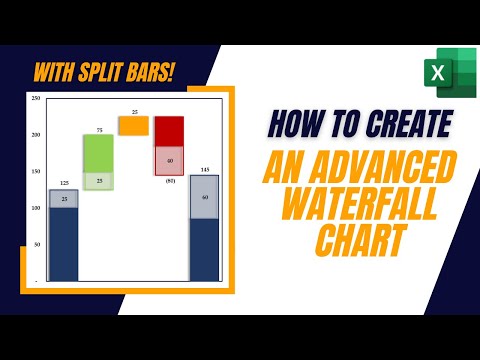 0 Views |
This visually appealing waterfall chart works great for creating an appealing variance analysis chart. I will cover how to set up the data table for creating the waterfall stacked column chart and how to incorporate split and intermediate bars into the chart. The waterfall chart template works for negative and positive movements and allows for the addition or subtraction of however many buckets you need to display. After watching this video you will be able to answer the question of how to create a waterfall chart with intermediate sub-totals and split bars in excel.
***Timestamps***
0:00 Introduction and Overview
2:00 Creating Data Table and Formulas for Chart
6:30 Inserting Stacked Column Chart for Waterfall Chart Template
10:30 Formatting Split Bars in Waterfall Chart
12:46 Adding Data Labels to Chart to a Waterfall Chart
15:58 Conclusion and Final Thoughts
Completed Template Available For Purchase:
https://www.etsy.com/listing/1270927978/excel-waterfall-chart-template-with
ExcelHelpNow Etsy Shop: https://excelhelpnow.etsy.com
— 25% off Everything in Store with Promo Code: YouTube25
Please take the opportunity to connect and share this video with your friends and family if you find it useful.


