
| Channel | Publish Date | Thumbnail & View Count | Actions |
|---|---|---|---|
 | Publish Date not found | 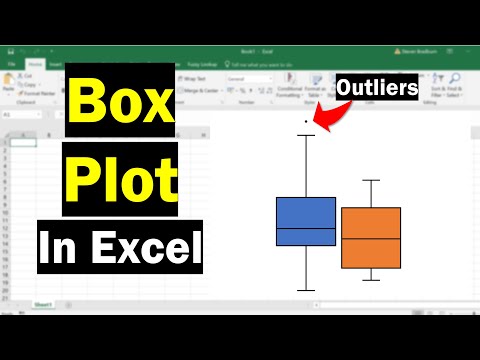 0 Views |
https://steven-bradburn.beehiiv.com/subscribe
In this tutorial, I’m going to show you how to easily create a box plot (box and whisker plot) by using Microsoft Excel. I’ll show you how to create a simple box plot with one data set, as well as multiple box plots so you can have two groups side by side.
HOW I CREATED THIS TUTORIAL (AFFILIATE LINKS)
Screen recorder & editor https://techsmith.z6rjha.net/c/1988496/506622/5161
Software (Microsoft Excel 365 ProPlus)
FOLLOW US
Website https://toptipbio.com/
Facebook https://www.facebook.com/TopTipBio/
Twitter https://twitter.com/TopTipBio
AFFILIATE DISCLAIMER
Some of the above links are affiliate links, meaning I will earn a commission if a sale is made after clicking on the link.
Please take the opportunity to connect and share this video with your friends and family if you find it useful.


