| Channel | Publish Date | Thumbnail & View Count | Actions |
|---|---|---|---|
 AuditExcel Advanced Excel and Financial Model Training and Consulting AuditExcel Advanced Excel and Financial Model Training and Consulting | 2023-10-18 12:59:55 |  8,455 Views |
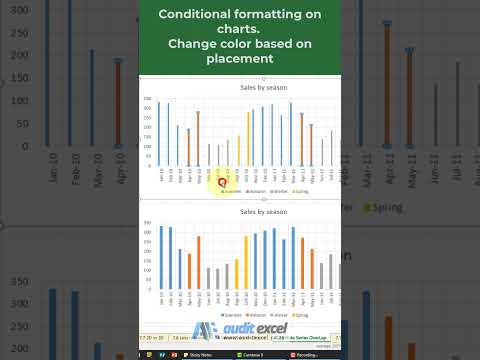
Conditional formatting on charts where it (looks like) the chart series change color midway through based on a formula or calculation. In this case the column charts change colors based on what season (summer, winter, fall, spring) the month falls into.
Please take the opportunity to connect and share this video with your friends and family if you find it useful.


