
| Channel | Publish Date | Thumbnail & View Count | Actions |
|---|---|---|---|
 Dr. Todd Grande Dr. Todd Grande | 2016-08-29 01:25:19 | 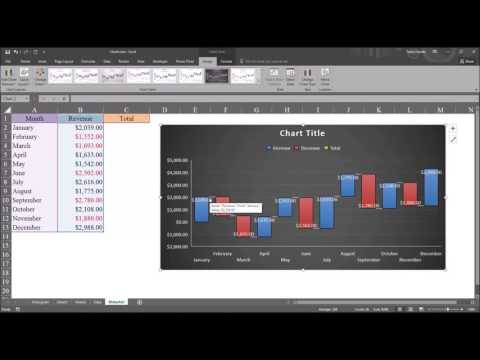 723 Views |
This video demonstrates how to create a waterfall chart (bridge chart) using Microsoft Excel 2016. Waterfall charts are used to produce running totals as additions and subtractions are made.
Please take the opportunity to connect and share this video with your friends and family if you find it useful.


