
| Channel | Publish Date | Thumbnail & View Count | Actions |
|---|---|---|---|
 | Publish Date not found | 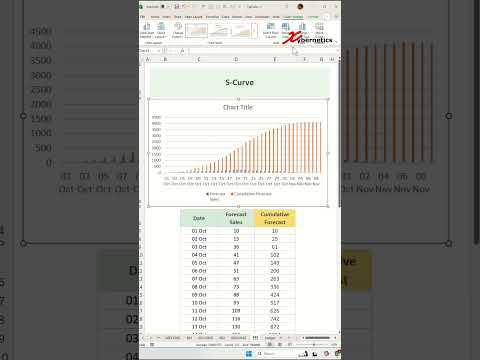 0 Views |
Learn how to create an s-curve chart in Excel.
Here are the steps outlined in my video.
Draw Chart
1) Ctrl+A
2) Alt+F1
3) Resize and reposition
Draw S-Curve
1) Select chart
2) Chart Design ~ Change Chart Type
3) Combo
4) Cumulative Forecast set to Secondary Axis
5) OK
#excel #tips #shorts #fyp
Please take the opportunity to connect and share this video with your friends and family if you find it useful.


