| Channel | Publish Date | Thumbnail & View Count | Actions |
|---|---|---|---|
 Rabi Gurung Rabi Gurung | 2023-10-15 13:00:19 |  3,236 Views |
I will also show you the equation to calculate normal distribution.
These are the steps outlined in the video.
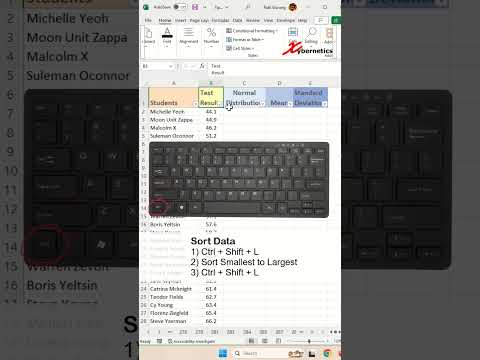
Sort Data
1) Ctrl + Shift + L
2) Sort Smallest to Largest
3) Ctrl + Shift + L
Mean Calculation
1) Select cell D2
2) =AVERAGE(B2:B76)
3) Whole number, Home ~ Number ~ Decrease Decimal
Standard Deviation
1) Select cell E2
2) =STDEV.P(B2:B76)
3) Whole number, Home ~ Number ~ Decrease Decimal
Normal Distribution
1) Select cell C2
2) =NORM.DIST(B2,$D$2,$E$2,FALSE)
3) Apply formula to rest of the rows.
Bell Curve
1) Select Test Results and Normal Distribution columns
2) Insert ~ Charts ~ Scatter
3) Scatter with smooth line
LINKS TO SIMILIAR VIDEOS
Bell Curve In Excel – Excel Tips and Tricks – DETAIL EXPLANATION
https://youtu.be/r8JghmYekg4?si=ev_q68puklh2C86C
Bell Curve In Excel – PART1 – Excel Tips and Tricks
https://youtube.com/shorts/Vmn8ei1UEZw?si=i5wnFUl8a2Mmlss2
Bell Curve In Excel – PART2 – Excel Tips and Tricks
https://youtube.com/shorts/SvZOS_n3fv4?si=OJNGpbM9Azr8IBCT
Area Chart Under Bell Curve In Excel – Excel Tips and Tricks – – DETAIL EXPLANATION
https://youtu.be/hSoikTRrPZg?si=1Vn7c_QHKpUgjGf9
Area Chart Under Bell Curve In Excel – PART1 – Excel Tips and Tricks
https://youtube.com/shorts/NC5DHVc30BY?si=7SgkR-VytTsYhXIn
Area Chart Under Bell Curve In Excel – PART2 – Excel Tips and Tricks
https://youtube.com/shorts/LU4G3HobJqw?si=lEyzzyWFWyheb4yT
Area Chart Under Bell Curve In Excel – PART3 – Excel Tips and Tricks
https://youtube.com/shorts/JiwxfDTgPcE?si=M7J7pP9KORBdN4qX
#tip #excel #microsoft #shorts #shortvideo #shortsvideo #howto #how #google
Please take the opportunity to connect and share this video with your friends and family if you find it useful.


